Statistics and probability also have the Z-Table (Standard Normal Table) which is a pretty important table. Whether you are preparing for exams as a student or working on data analysis as a professional, getting to know about Z-Table is very essential. but some people are puzzle by these numbers Don’t fret - this guide will wipe out a bit of that confusion and assist you in getting past the Z-Table forever.
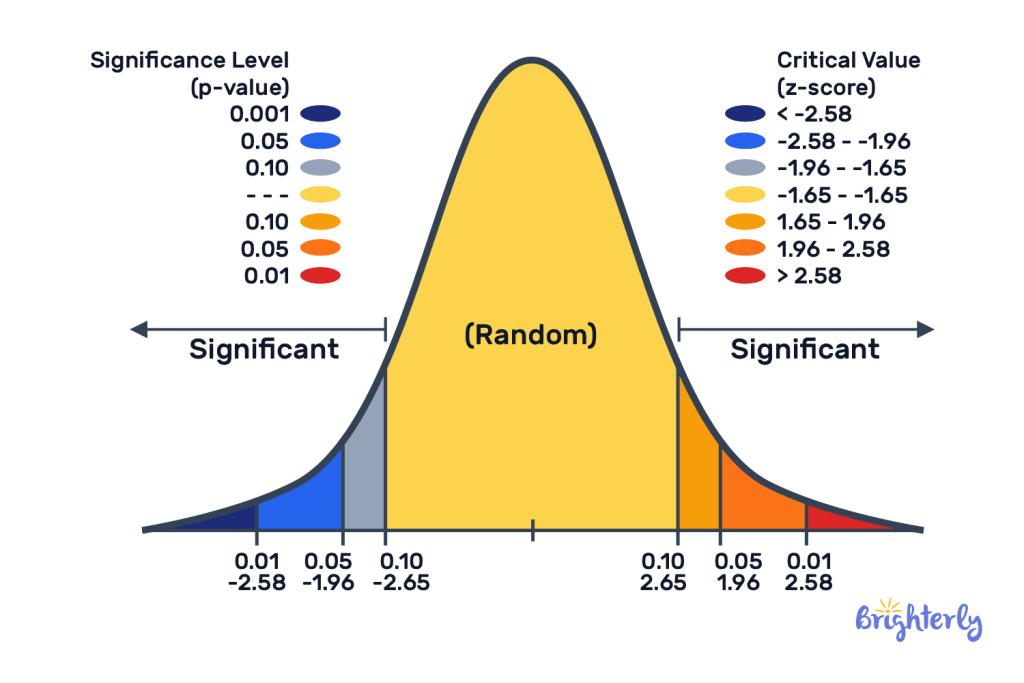
★Normal Distribution: A normal distribution is a typical continuous probability distribution that looks like a bell and is symmetrical. many natural phenomena (height, test scores etc) roughly follow the normal distribution Standard Normal Distribution: it is a normal distribution whose mean is 0 and standard deviation is 1.
★Z-Score: Any normal distribution can be transformed into a standard normal distribution using the formula Z = (X - μ) / σ. The Z-score indicates "how many standard deviations a data point is from the mean."
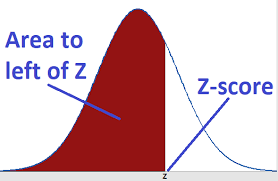
★Z-Table: The core function of this table is to tell us the cumulative probability corresponding to any Z-score. This probability represents "the area (probability) under the standard normal distribution curve that is less than a given Z-score."
Z table is sort of bridge between Z score and probabilities in simple terms.
In simple terms, the Z-Table acts as a bridge connecting Z-scores and probabilities.
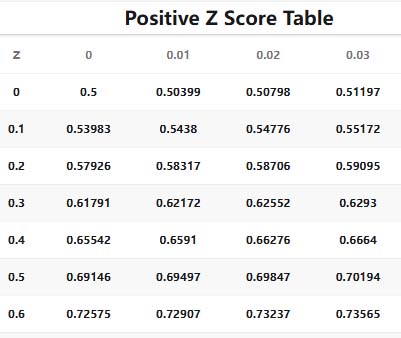
First you should know what the standard structure of a Z Table is like:
★First Column: Integer part of Z-score and first decimal place
★Top row: The second decimal place of the z score
★The main part of the table: the corresponding cumulative probability P(Z ≤ z).
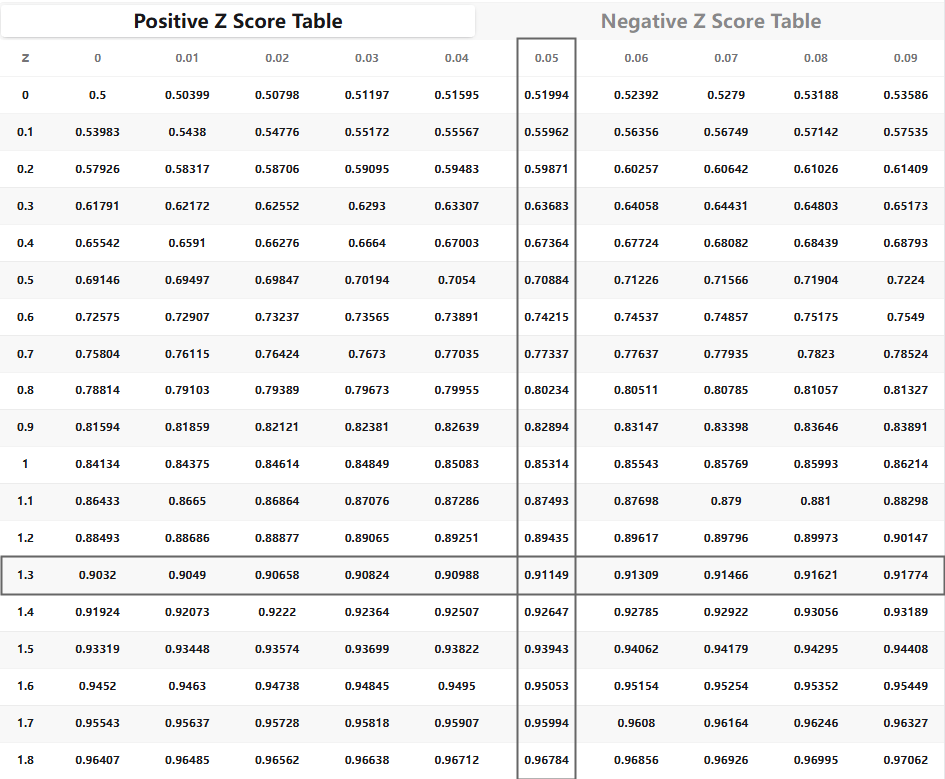
Suppose we want to find the probability of a Z-score less than or equal to 1.35
★1. Locate the row: Find 1.3 in the first column.
★2. Locate the column: Find 0.05 in the top row.
★3. Find the intersection: move to the right along the row with 1.3 and move down along the column with 0.05, the number at this cell is 0.91149
Conclusion: P(Z ≤ 1.35) = 0.91149 which means that if we look at a standard normal distribution, it implies that around 91.149 percent of the data points lie in the area where Z - score is less than or equal to 1.35
we often need the right tail probability. But because the table provides left-tail cumulative probability, we must do some tricks.
1. find the left-tail probability: find P(Z ≤ 0.78).
★Row: 0.7
★Column: 0.08
★Intersection probability: 0.7823
2. Find right-tail probability: Total area is 1, so P(Z > 0.78) = 1 - P(Z ≤ 0.78) = 1 - 0.7823 = 0.2177. Conclusion: 21.77% of data lies in between range which is greater than Z=0.78 It is the simplest way to calculate right tail probability and can be used for learning one-tailed test.
★One-Tailed Test: Your research hypothesis is directional. For example, "The new drug is more effective than the old drug." You are only concerned with one end of the distribution (the right tail, i.e., the "better" direction). The p-value you calculate (e.g., 0.2177 above) is a one-tailed p-value.
★Two-Tailed Test: Your research hypothesis is non-directional. For example, "The new drug and the old drug have different effects." You are concerned with both ends of the distribution (it could be either better or worse). In this case, you need to multiply the one-tailed probability by 2.
Example:
If our former p = P(Z > 0.78) = 0.2177 had been a one-tailed p-value, then the two-tailed p -value corresponding to this Z score would have been 0.2177 × 2 = 0.4354
Key Takeaway: The Z Table is simply a table that gives you the left tail cumulative probability. It's how you use that probability to figure out your p value for doing hypothesis tests that makes all the difference
If you find it a bother to look at the table yourself, there are also online calculators that can immediately give you the probability if you enter your z-score.
Recommended Tool: P value calculator
We have prepared high-definition printable Z-Table Files in PDF & Excel Format for Offline Learning / On-the-go learning.
★excel z table: z table excel files
★pdf z table: z table pdf files