In the fields of statistics and data analysis, the normal distribution is often hailed as the "distribution created by God." Its ubiquitous nature makes it a crucial model for understanding the world. The 68-95-99.7 rule is the most intuitive and powerful key to unlocking the mysteries of the normal distribution. This article will explain this rule in simple terms and reveal its profound connection with the Z-score, helping you build a solid foundation in data analysis.
The normal distribution, also known as the Gaussian distribution, is a continuous probability distribution characterized by its symmetrical bell-shaped curve. In nature and social sciences, numerous phenomena approximately follow this distribution, such as the height of adults, measurement errors, and test scores. The 68-95-99.7 rule specifically describes the approximate proportion of data distributed around the mean in a perfect normal distribution.
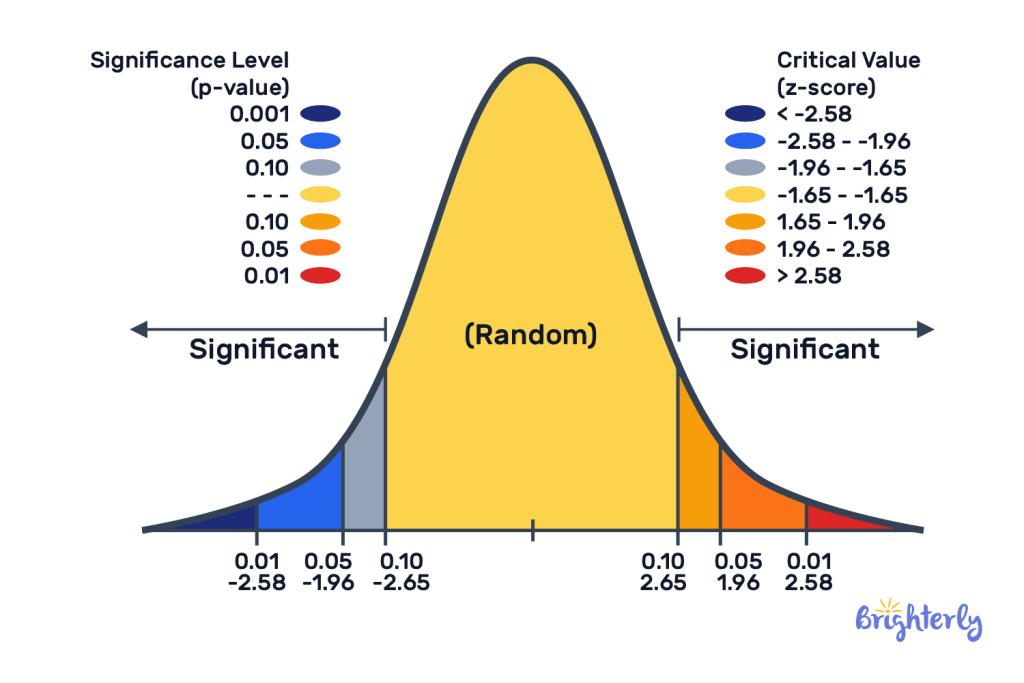
This rule precisely describes the probability of observations falling within specific ranges around the mean in a normal distribution:
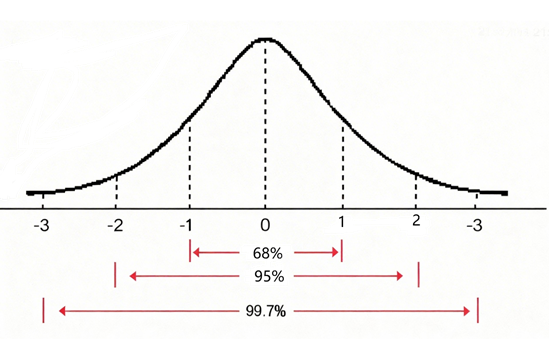
★68% of the data falls within 1 standard deviation of the mean (μ ± 1σ).
★95% of the data falls within 2 standard deviations of the mean (μ ± 2σ).
★99.7% of the data falls within 3 standard deviations of the mean (μ ± 3σ).
This means that once the mean (μ) and standard deviation (σ) of the data are determined, we can quickly gain a macro-level and accurate grasp of the overall data distribution.

An intuitive representation of the 68-95-99.7 rule in a normal distribution, showing the proportion of data within different standard deviation ranges.
To put this rule into practice, it's essential to introduce the concept of the Z-score. The Z-score, or standard score, is a dimensionless statistic that measures how many standard deviations a data point is from the mean.
Its calculation formula is:
\(Z =\frac{X - \mu}{\sigma}\)
Where:
★X: Individual observed value
★μ: Population mean
★σ: Population standard deviation
The Z-score perfectly quantifies the 68-95-99.7 rule:
★When |Z| ≤ 1, the observation lies within the interval containing 68% of the data.
★When |Z| ≤ 2, the observation lies within the interval containing 95% of the data.
★When |Z| ≤ 3, the observation lies within the interval containing 99.7% of the data.
Therefore, the Z-score is the bridge that standardizes any normal distribution and allows direct application of the 68-95-99.7 rule. By calculating the Z-score, we can evaluate and compare any dataset on a unified standard scale. You can use our online z-score calculator for quick calculations.
A standard normal distribution plot with the Z-score as the horizontal axis, intuitively showing the correspondence between Z-scores and the 68-95-99.7 rule.
Understanding the combination of this rule and the Z-score can significantly enhance the efficiency and insight of data analysis:
In a production line, if a part's specified length is 100mm with a standard deviation of 2mm. Applying the rule shows that approximately 95% of the parts will have lengths between 96mm and 104mm (Z-scores between ±2). If a significant number of products fall outside this range, it indicates a potential issue with the production process.
Scores on standardized tests (like the SAT, GRE) are often scaled to follow a normal distribution. If the test has a mean score of 500 and a standard deviation of 100, then only about 0.3% of test-takers will score above 800 (Z-score > 3). This makes score interpretation and candidate placement extremely clear.
It is important to note that the 68-95-99.7 rule is an empirical rule, strictly applicable to perfect normal distributions. Real-world data is often only approximately normal. The further the data deviates from a normal distribution, the less accurate this rule becomes.
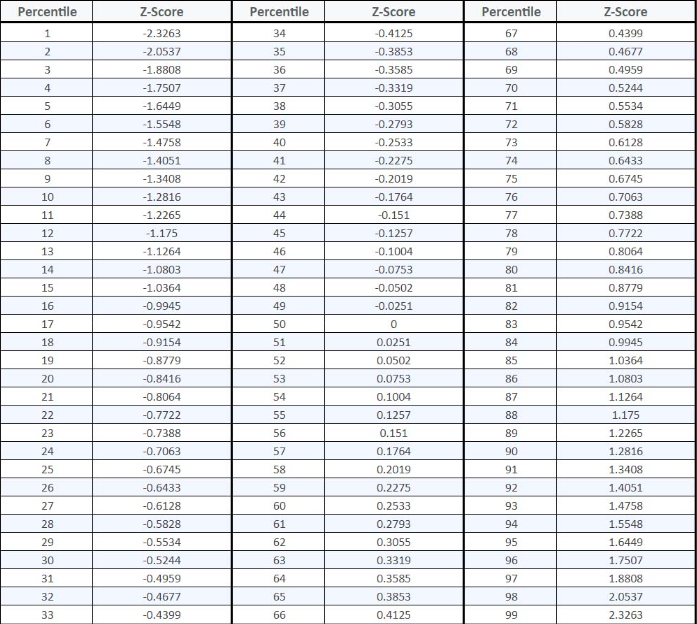
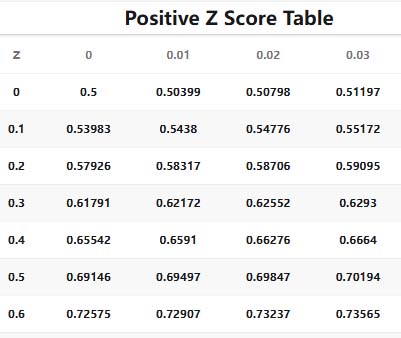
Nonetheless, it remains an indispensable preliminary diagnostic tool in data analysis. It helps analysts quickly assess the dispersion of data, identify potential outliers, and lay the groundwork for more complex statistical models. You can use our z-table to determine precise probabilities for specific Z-scores.
The 68-95-99.7 rule, in its concise form, encapsulates the core wisdom of the normal distribution. Combined with the Z-score, it provides us with a language to quickly decode data distributions. Mastering this tool means you can swiftly identify key characteristics within complex data and make more data-driven decisions. In an era where the value of data is increasingly prominent, this is undoubtedly a vital core skill.