If you’re diving into hypothesis testing, you’ll run into the Z-score critical value table sooner or later. Whether you’re a researcher, a student, or someone crunching numbers in business or quality control, knowing how to use these tables can make or break your analysis.
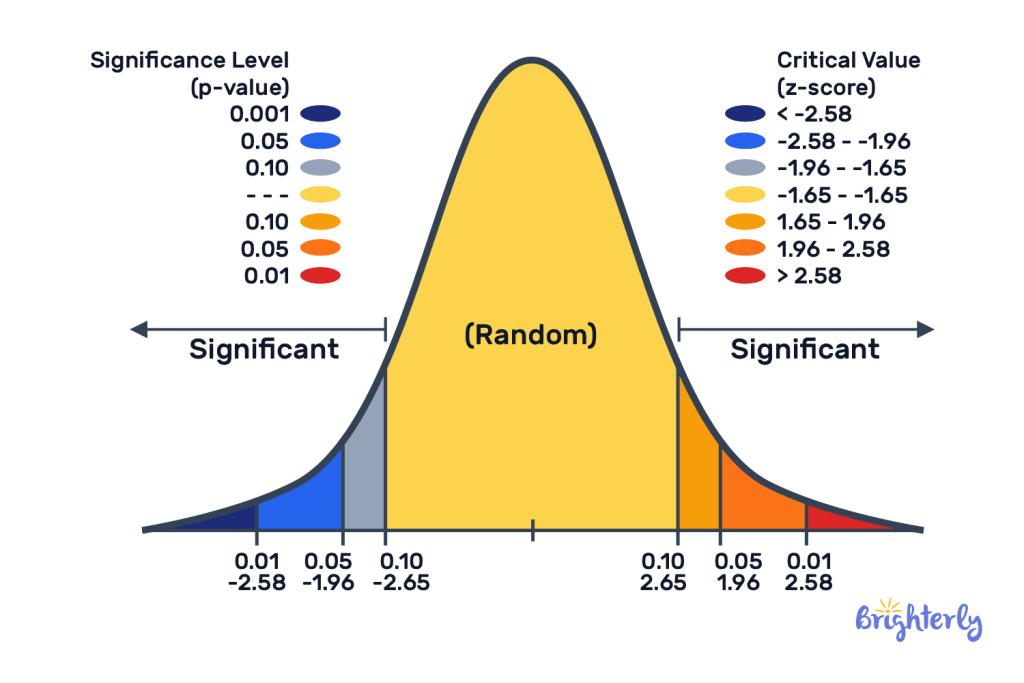
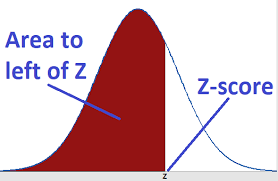
Think of the Z-score critical value as the line in the sand during hypothesis testing. It’s the cutoff that tells you whether your results are surprising enough to reject the null hypothesis. In plain terms, it’s a number from the standard normal distribution matched to your chosen significance level (the α-level). Cross that line, and you’ve got statistically significant results.
Significance Level (α): This is the chance you’ll make a Type I error—basically, saying there’s an effect when there isn’t. The usual suspects:
★α = 0.10 (90% confidence)
★α = 0.05 (95% confidence)
★α = 0.01 (99% confidence)
Confidence Level: Just 1 minus α. It shows how much trust you can put in your results.
Critical Value: The Z-score that marks your chosen α-level boundary.
Usually, you will see a table listing the most commonly used Z-value thresholds. (If you need a specific one, you can use an online calculator to calculator.)
| Confidence Level | Two-tailed Critical Value | One-tailed Critical Value | |
|---|---|---|---|
| 90% | ±1.645 | 1.282 | |
| 95% | ±1.960 | 1.645 | |
| 99% | ±2.576 | 2.326 | |
| 99.90% | ±3.291 | 3.09 |
4.1.1 One-Tailed Test
★Use this when you care about one direction—like, is the new drug better than the old one?
★The critical value sits at one end of the bell curve.
★Example: Testing if a new product outperforms the standard.
4.1.2 Two-Tailed Test
★Use this for changes in either direction—maybe something’s just different, not necessarily better or worse.
★Here, critical values go on both sides.
★Example: Seeing if a new teaching method changes results compared to the old way, in any direction.
Step 1: Pick your significance level. Social sciences usually go with 0.05. Medical studies like to play it safer at 0.01.
Step 2: Figure out if your question calls for a one-tailed or two-tailed test.
Step 3: Look up your critical value in the table based on your choices above.
Step 4: Make your decision:
★If the absolute value of your Z statistic beats the critical value, reject the null hypothesis.
★If not, stick with the null.
A factory says their bolts are 5 cm long. You grab a sample of 36 bolts, find their average is 5.1 cm, and the standard deviation is 0.6 cm. Time to check if they meet the standard.
★1. Hypotheses: H₀: μ = 5cm; H₁: μ ≠ 5cm.
★2. Significance: α = 0.05, two-tailed.
★3. Z = (5.1 - 5) / (0.6/√36) = 1.0.
★4. Critical value: ±1.96.
★5. Since 1.0 is less than 1.96, you don’t reject the null.
★6. Conclusion: The bolts meet the standard.
A pharma company wants to prove their new medication works better than the old stuff. They set up a one-tailed test at α = 0.01.
★1. Calculated Z = 2.45.
★2. Critical value for one tail at 0.01 = 2.326.
★3. 2.45 beats 2.326, so you reject the null.
★4. Result: The new drug really does work better.
Online Z critical value calculators make life easier. Here’s why:
★Get exact values for any confidence level.
★Skip the risk of messing up while reading a table.
★Fast calculations save you time.
★Handle weird significance levels you won’t find in standard tables.
★Show results visually.
★Automatically figure out one-tailed or two-tailed setups.