If you spend any time with statistics, you'll run into Z-scores and P-values everywhere. They're the backbone of hypothesis testing, they flag outliers, and they help you figure out where a number sits in a big mess of data. Let's break down what each one means and how they connect.
A Z-score (also called a standard score) tells you how far a data point is from the average, measured in standard deviations. Here's the formula:
\(Z = \frac{X - \mu}{\sigma}\)
Where:
★X = your data point
★μ = the population mean
★σ = the population standard deviation
Z-scores let you compare apples to oranges—well, kind of. They standardize numbers from different datasets so you can actually line them up next to each other. A Z-score of 2? That means your number is two standard deviations above average. Simple as that.
A P-value is all about probability. It answers the question: "If the null hypothesis is true, how likely is it that I'd see results this extreme (or more) just by random chance?" In plain English, it's your evidence meter.
★Small P-value (usually 0.05 or less): This says your results are weird enough that randomness doesn't really explain them, so you toss out the null hypothesis.
★Large P-value (over 0.05): Your results look pretty normal under the null hypothesis, so you have no reason to reject it.
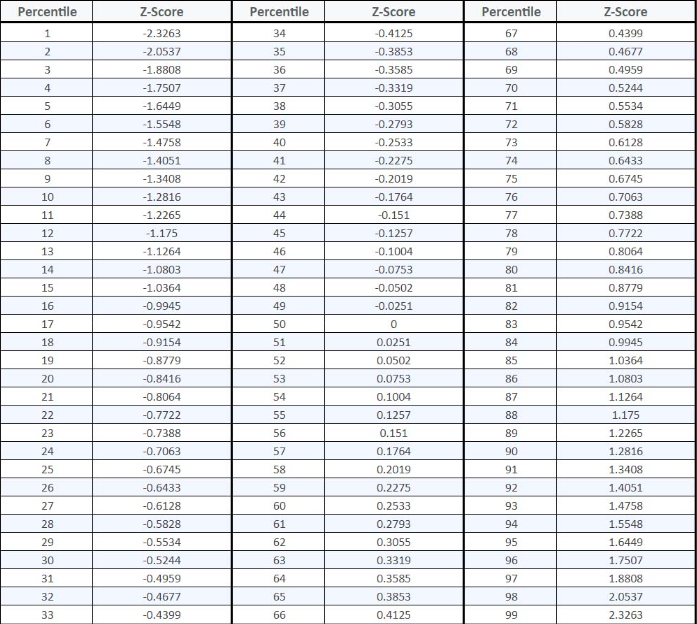
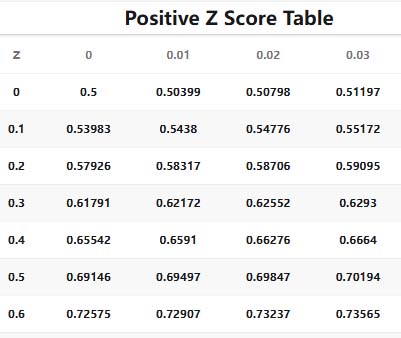
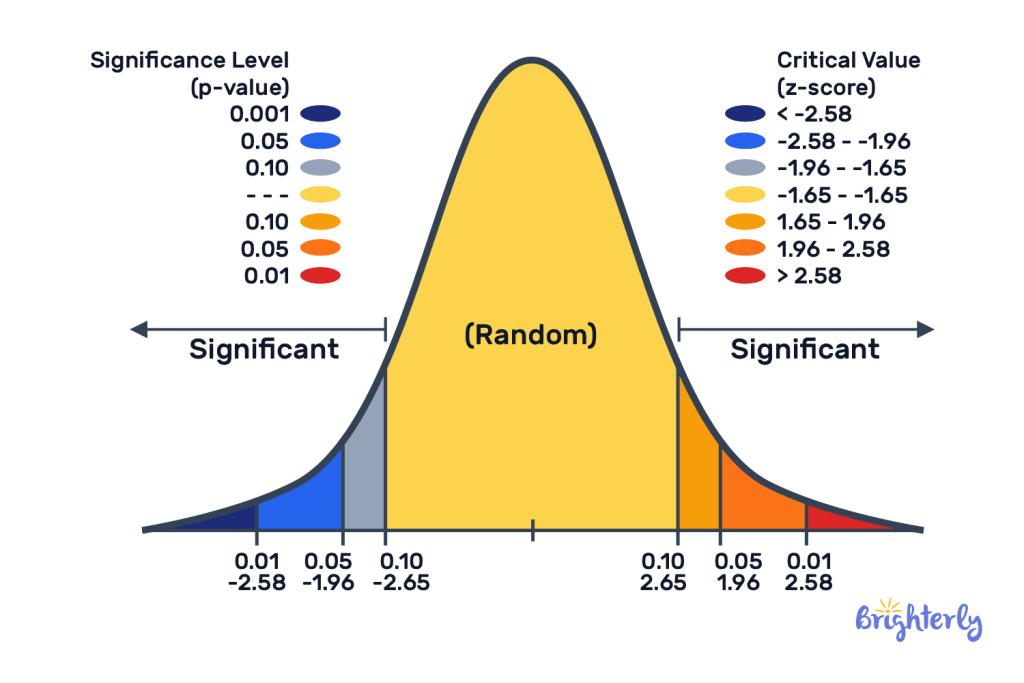
Here's where it gets interesting. Z-scores and P-values are tied together by the Standard Normal Distribution—the famous bell curve.
Once you've got your Z-score, you can look up the matching P-value in a Z-table or let software crunch the numbers. That P-value shows the area under the bell curve from your Z-score out to the tail.
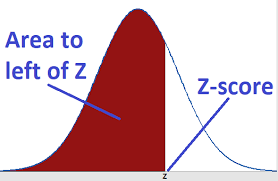
★Left-tailed test? The P-value is the area to the left of your Z-score.
★Right-tailed test? It's the area to the right.
★Two-tailed test? Add up the areas in both tails (basically, double the one-tail value for the positive and negative Z-scores).
It works the other way, too. If you know the P-value you want for your test (the significance level), you can find out which Z-score lines up with it. That's your critical value.
Let's be honest, flipping through a Z-table is a pain and easy to mess up. That's why we built a Z-Score to P-Value Calculator.
How it works:
1. Go to our p value Calculator.
2. Type in your Z-score.
3. Get your P-value right away.
Let's say a researcher wants to test a new drug. The null hypothesis: "No effect." After collecting data, she gets a Z-score of 2.5.
Using the calculator, she picks a right-tailed test, pops in 2.5, and gets a P-value of about 0.0062.
What does that mean? That P-value is way below 0.05, so she's got solid evidence to reject the null hypothesis. The drug has a real effect.
A: Yes, you can. A negative Z-score just means you're looking at the left side of the distribution. When you're figuring out the P-value, it all depends on which side (or "tail") your hypothesis test cares about. For a left-tailed test, the P-value for a negative Z-score is just the area to the left of that score.
A: Online calculators (like the one here) usually win—hands down. They're faster and crunch the numbers using exact math, while Z-tables only give you rounded numbers.
A: The Z-score tells you how far and in which direction your data point is from the average—think of it as a measure of distance and direction. The P-value, on the other hand, tells you how strong your evidence is against the null hypothesis. In other words, it shows you the odds that what you're seeing is just random chance.
If you want to really understand statistics, you need to know how Z-scores and P-values work together. Converting a Z-score to a P-value lets you see how significant your results are—no guesswork. So, next time you've got a Z-score, skip the old-school tables. Just use our online tool for a quick, accurate result and make your analysis smoother and more reliable.