★Core Concept: Quantifies data's position within a group (similar to exam rankings but more precise)
★Calculation Formula
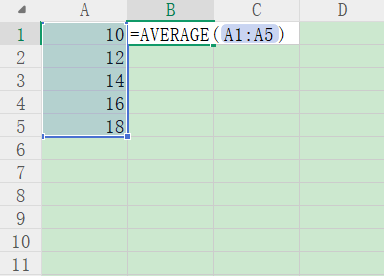
Standard Score = \(\frac{X - \mu}\sigma\)
Calculation formula:
\(Z = \frac{X - \mu}{\sigma}\)
(Tools available for automatic computation, no manual calculation required)
★Z > 0 = Exceeding industry benchmarks
(Example: A bubble tea shop’s daily sales Z=1.8 indicates 20% higher performance than district averages, enabling rapid replication of successful models)
★Z = 0 = Precise alignment with industry standards
(Example: Logistics companies use Z=0 to calibrate "next-day delivery success rates" and dynamically adjust resource allocation)
★Z < 0 = Risk warning signal
(Example: When a restaurant’s table turnover Z=-2.1, a 3-week optimization plan increased revenue by 23%)
Three methods:
★Health Management:
Height Z=1.5 (top 3% of peers) vs. Body fat Z=0.3 → Tailored fitness plans
★E-commerce Operations:)
✓ Inventory turnover Z=2.3 → Warns of bestseller stockouts
✓ Stockout rate Z=-1.8 → Triggers smart replenishment (37% reduction in losses for a leading platform)
★Manufacturing QC:
Product pass rate Z=0.8 vs. Energy efficiency Z=-0.5 → Prioritizes energy-saving upgrades
★Corporate Credit:Z < -3 → 82% cash flow crisis within 1 year (triggers loan management)
★Healthcare:Blood pressure Z < -2.5 → Activates AI pre-diagnosis
★Facility Maintenance:Z > 2.5 → 41% improvement in elevator failure prediction accuracy
\(Z = \frac{X - \mu}{\sigma}\)
Metrological Connotation of Parameters:
| Parameter | Physical Definition | Metrological Significance |
|---|---|---|
| X | Raw measurement value (Sensor output/Instrument reading) |
• Contains true value, systematic error (δ), and random error (εₐ) • Requires distinction between indication error and corrected value |
| \(\mu\) | Theoretical reference (SI unit definition/Calibration standard) |
• Traceable through metrological hierarchy • Must maintain 10x higher precision than σ |
| \(\sigma\) | Intrinsic uncertainty (Instrument resolution + environmental noise) |
• Evaluated per GUM Type A/B methods • Considers temporal drift and thermal effects |
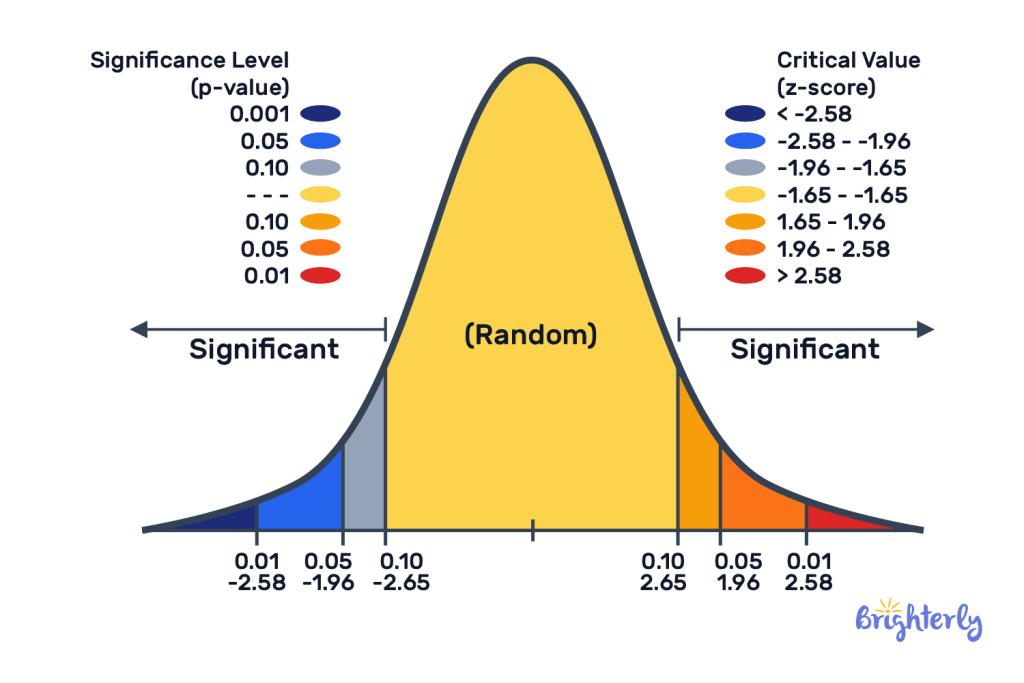
| Z Range | Statistical Significance | Universal Recommendations | Typical Applications |
|---|---|---|---|
| [3.0, +∞) | Top 0.13% of population |
1. Develop benchmark promotion plan 2. Establish abnormal return verification |
Historical peak performance indicators Special scenario detection |
| 1.96-2.5 | Significant difference (p < 0.05) |
1. Create strategy validation process 2. Initiate standardized replication |
Strategy effectiveness confirmation Quality certification standards |
| 1.28-1.96 | Exceeds 89.97% peers |
1. Allocate dedicated resources 2. Build advantage consolidation mechanism |
Top-tier resource selection Key talent identification |
| 0.5-1.28 | Above 68% industry baseline |
1. Optimize operational workflows 2. Develop best practice repository |
Performance reward thresholds Baseline evaluation metrics |
| 0-0.5 | Marginally above average |
1. Implement incremental improvement 2. Setup dynamic monitoring system |
New initiative pilot assessment Service compliance thresholds |
| -0.5-0 | Near industry norm |
1. Enhance process controls 2. Launch periodic review cycles |
Operational quality oversight Satisfaction baseline tracking |
| -1.28-0.5 | Below 31% competitors |
1. Conduct root cause analysis 2. Deploy emergency response resources |
Performance intervention points Quality alert management |
| -1.96-1.28 | Significant disadvantage (p < 0.05) |
1. Initiate corrective action plan 2. Execute cost restructuring |
Financial risk alerts Project termination criteria |
| [-∞, -2.5] | Extreme outlier |
1. Activate crisis management protocols 2. Execute organizational contingency response |
Survival risk warnings Life-critical medical indicators |