From Basic Concepts to Practical Applications
A confidence interval is a range used in statistics to estimate population parameters. When we say "95% confidence interval," it means that if we repeated sampling 100 times, approximately 95 of those intervals would contain the true population parameter. Confidence intervals are not probability statements but reliability statements based on frequentist statistics.
A Z-score, also known as a standard score, represents how many standard deviations a data point is from the mean. In confidence interval calculations, the Z-score serves as a critical value that determines the width of the confidence interval. The larger the Z-score, the wider the confidence interval, and the higher our certainty about the estimate.
Key Point : Z-scores bridge sample statistics with population parameters, quantifying the uncertainty of our estimates.
Confidence Interval = Sample Statistic ± (Z-Score × Standard Error)
Where:
★Sample statistic can be mean, proportion, etc
★Z-score depends on the confidence level
★Standard error reflects sampling variability
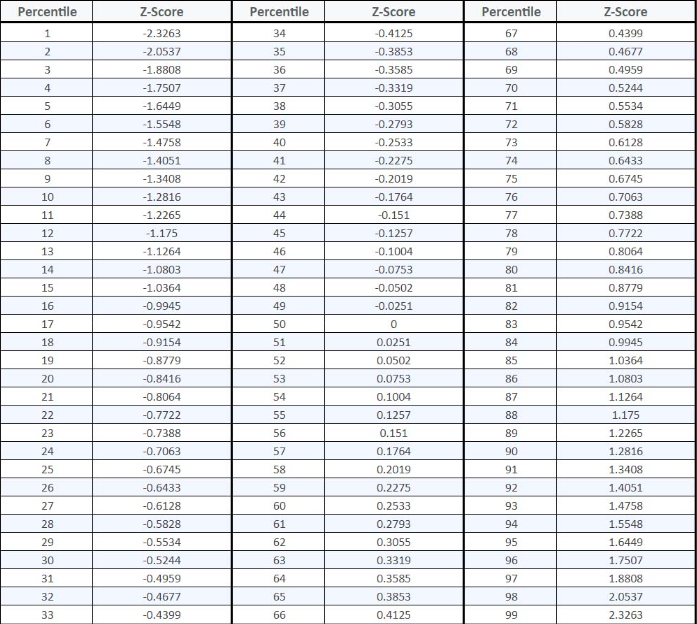
To calculate the Z-score for any confidence level, you can use our percentile to z score online calculator
The following table lists Z-score values for common confidence levels (two-tailed test):
| Confidence Level | Z-Score | \(\alpha\) Value | Standard Error Multiple | Application Scenario |
|---|---|---|---|---|
| 80% | 1.282 | 0.2 | 1.282\(\sigma\) | Preliminary exploratory research |
| 85% | 1.44 | 0.15 | 1.440\(\sigma\) | Internal decision analysis |
| 90% | 1.645 | 0.1 | 1.645\(\sigma\) | General business analysis |
| 95% | 1.96 | 0.05 | 1.960\(\sigma\) | Academic research standard |
| 99% | 2.576 | 0.01 | 2.576\(\sigma\) | High-precision scientific research |
| 99.50% | 2.807 | 0.005 | 2.807\(\sigma\) | Medical clinical trials |
| 99.90% | 3.291 | 0.001 | 3.291\(\sigma\) | Extremely high precision requirements |
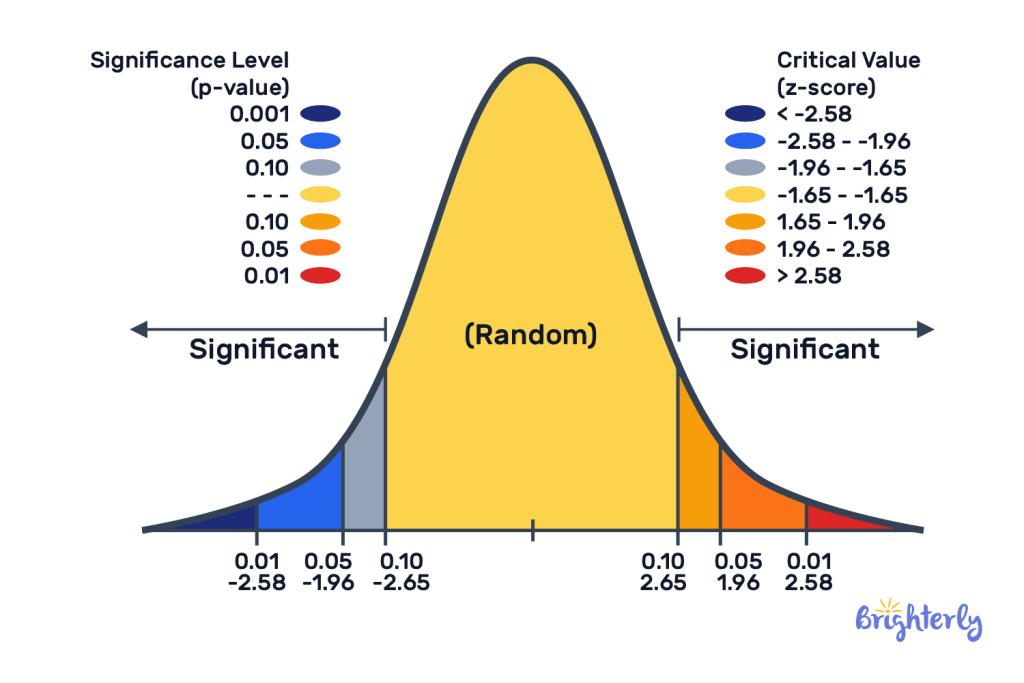
You may have noticed that the Z-value reference table is labeled "two-tailed test." This is because when constructing confidence intervals, we almost always use Z-scores from two-tailed tests.
Used to estimate the possible range of a parameter without preset direction. For example, when estimating "candidate support rate," the result could be higher or lower than the sample value, so we reserve rejection regions at both ends of the normal distribution. Confidence interval construction is inherently two-tailed.
Used to test whether a parameter is strictly greater than or less than a certain value, setting rejection regions only at one end of the distribution. It's typically used for hypothesis testing rather than constructing confidence intervals.
For your convenience in various statistical scenarios, the following table lists Z-values for both one-tailed and two-tailed tests at common confidence/significance levels:
| Confidence Level (Two-tailed) | Significance Level \(\alpha\) | Two-tailed Z-Score | Confidence Level (One-tailed) | Significance Level \(\alpha\) | One-tailed Z-Score |
|---|---|---|---|---|---|
| 80% | 0.2 | 1.282 | 90% | 0.1 | 1.282 |
| 90% | 0.1 | 1.645 | 95% | 0.05 | 1.645 |
| 95% | 0.05 | 1.96 | 97.50% | 0.025 | 1.96 |
| 99% | 0.01 | 2.576 | 99.50% | 0.005 | 2.576 |
| 99.90% | 0.001 | 3.291 | 99.95% | 0.0005 | 3.291 |
Conversion Relationship : A two-tailed test at 95% confidence level has tail areas of 2.5% each. Therefore, its Z-value (1.96) also corresponds to a one-tailed test at 97.5% confidence level.
When constructing confidence intervals, the standard practice is to use Z-scores from two-tailed tests, primarily for the following reasons:
The core purpose of confidence intervals is to estimate a possible range for population parameters. Since we cannot predict whether the true parameter is higher or lower than our sample estimate, leaving error margins on both sides of the sample statistic (i.e., "±") most completely reflects this uncertainty.
Two-tailed tests are more conservative than one-tailed tests. They provide wider intervals, meaning we take a more cautious approach to parameter estimation, resulting in more robust conclusions that are widely accepted in academia and industry as standard practice.
A 95% confidence interval means that in repeated sampling, 95% of such intervals will cover the true population parameter. "Cover" here means the true parameter could fall anywhere within the interval, including the left or right side. This is completely consistent with the logic of two-tailed tests.
One-tailed tests mainly appear in hypothesis testing, when you have strong prior theory or only care about effects in one direction. For example, when testing whether a new drug is "strictly superior" to existing medication, or examining whether a production process defect rate is "strictly below" a certain standard, you would use one-tailed tests and their corresponding Z-values for decision making.
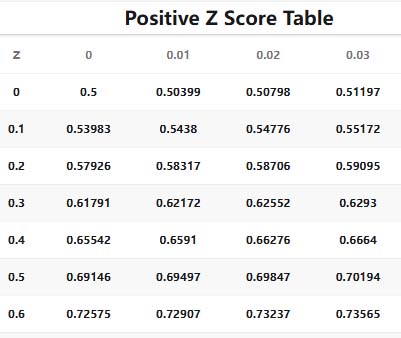
This is one of the most common questions in statistics. The number 1.96 comes from the standard normal distribution:
★In a standard normal distribution, 95% of data falls within mean ± 1.96 standard deviations
★More precisely, it's the critical value for the middle 95% region of the distribution
★Calculation method: Find the 97.5% quantile of the standard normal distribution (because two-tailed tests have 2.5% on each side)
Mathematically expressed as: Z = Φ⁻¹(0.975) ≈ 1.96
Where Φ⁻¹ is the inverse of the standard normal distribution.
Method 1: Standard Formula
For any confidence level (1 - \(\alpha\)), the corresponding Z-score is:
\(Z = \phi^{-1}(1 - \frac{\alpha}{2})\)
Example: Calculate Z-score for 90% confidence level
★α = 1 - 0.90 = 0.10
★\(\frac{\alpha}{2}\) = 0.05
★1 - \(\frac{\alpha}{2}\) = 0.95
★Z = \(\phi^{-1}\)(0.95) ≈ 1.645
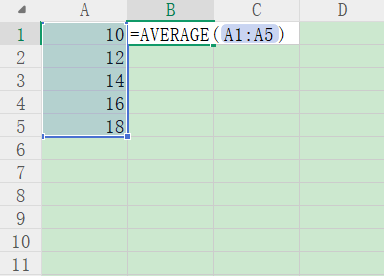
Method 2: Using Excel
In Excel, use the NORM.S.INV function:
=NORM.S.INV(1 - (1-confidence_level)/2)
For example, to calculate Z-score for 95% confidence level:
=NORM.S.INV(0.975) returns 1.95996 ≈ 1.96
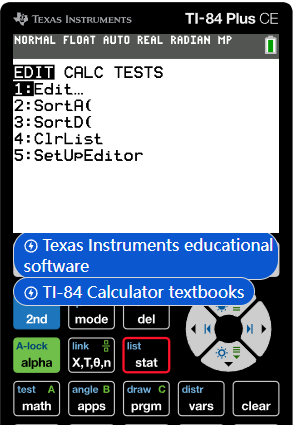
Method 3: Using Statistical Calculator
In TI-84 calculator:
step 1:Press 2nd → DISTR
step 2:Select 3:invNorm(
step 3:Enter invNorm(0.975)
step 4:Get result 1.96
An e-commerce platform wants to estimate the 95% confidence interval for average customer spending:
★Sample mean: ¥350
★Sample standard deviation: ¥50
★Sample size: 100
★Standard error = 50/√100 = 5
★Z-score (95%) = 1.96
Confidence interval = 350 ± (1.96 × 5) = 350 ± 9.8 = [340.2, 359.8]
Conclusion: We are 95% confident that the average spending of all customers is between ¥340.2 and ¥359.8
In a clinical drug trial, researchers calculate the 99% confidence interval for treatment effectiveness rate:
★Sample effectiveness rate: 75%
★Sample size: 200
★Standard error: √[0.75×(1-0.75)/200] ≈ 0.0306
★Z-score (99%) = 2.576
Confidence interval = 0.75 ± (2.576 × 0.0306) = 0.75 ± 0.0788 = [0.6712, 0.8288]
Conclusion: We are 99% confident that the true drug effectiveness rate is between 67.12% and 82.88%