In statistical analysis, percentiles are crucial indicators for determining the relative position of data points within a dataset. This guide provides a systematic explanation of calculating percentiles using Z-scores, along with practical tool recommendations.
A percentile divides a dataset into 100 equal parts, where the p-th percentile indicates that p% of data points are less than or equal to this value. Key examples:
★50th percentile = Median
★75th percentile = Upper quartile
Calculation formula:
\(Z = \frac{X - \mu}{\sigma}\)
Where:
★X: Raw score
★\(\mu\): Mean of the dataset
★\(\sigma\): Standard deviation
This standardization process eliminates scale differences between datasets.
★Compute dataset mean \(\mu\) and standard deviation \(\sigma\)
★Apply the Z score formula
Three methods:
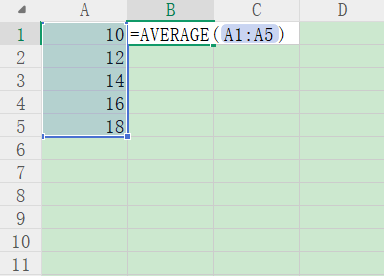
★Excel function: =NORM.S.DIST(z, TRUE)
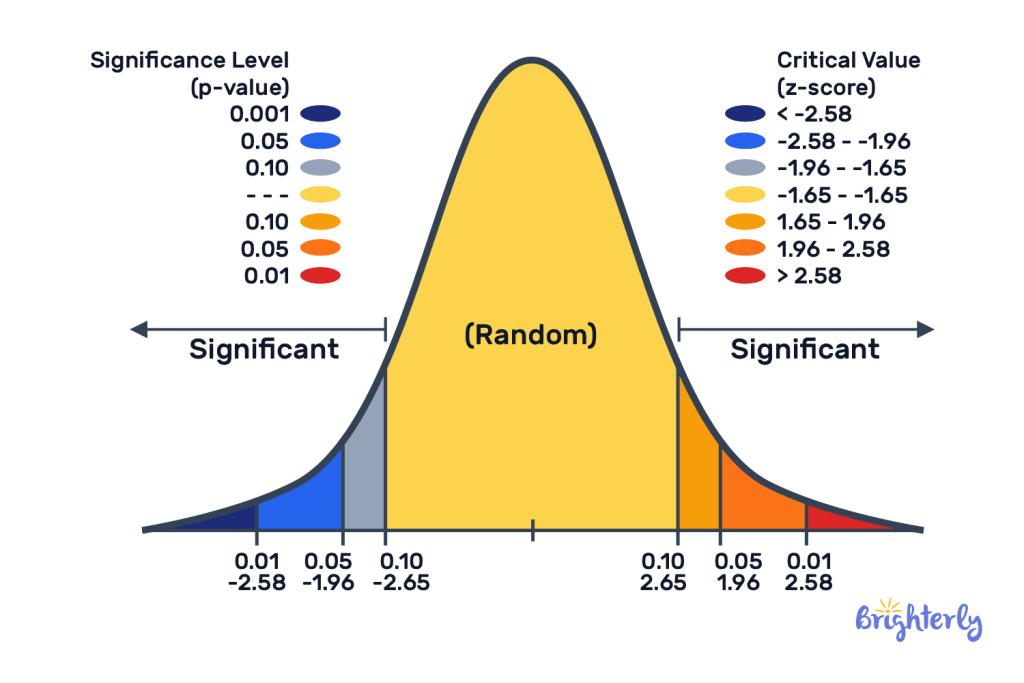
★Online tool: P value Calculator
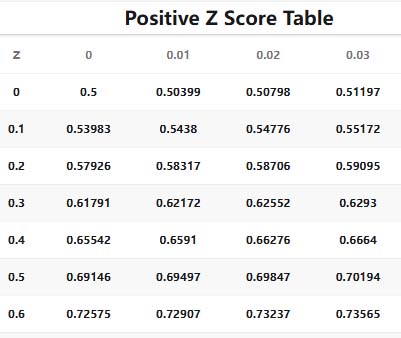
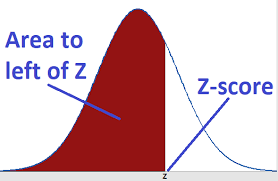
Conversion formula:
Percentile = P(Z ≤ z) × 100
Example calculation (Z = 1.28):
★Cumulative probability: 0.8997
★0.8997×100=89.970.8997×100=89.97
★Rounded to 90th percentile
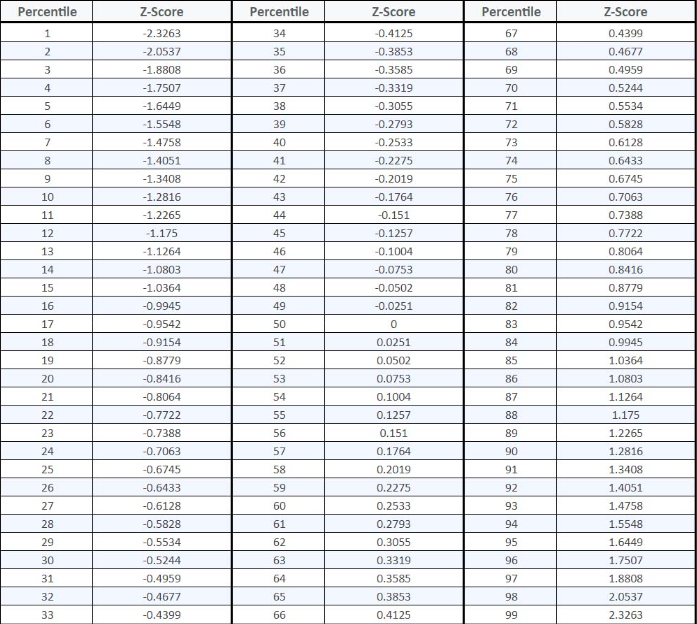
For practical applications, here's an enhanced reference table showing both common Z-scores and their corresponding integer percentiles